What archaeology says
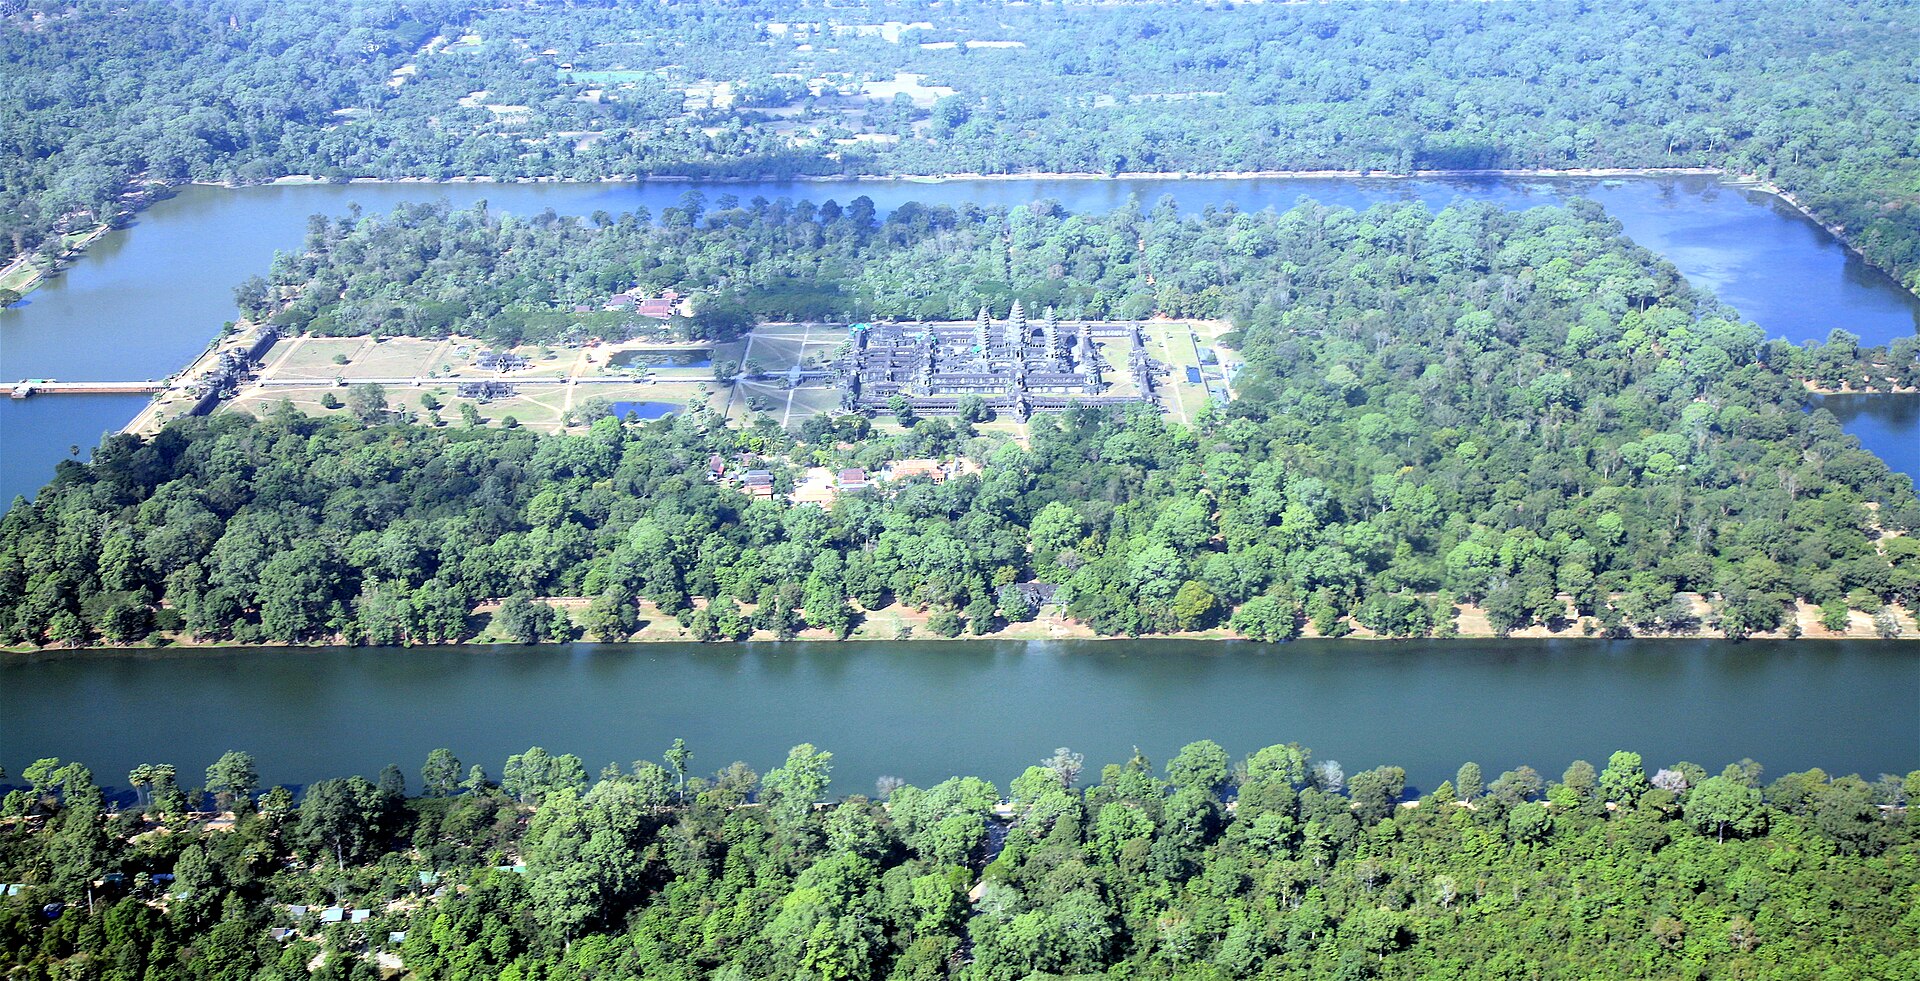
Historians and archaeologists date Angkor Wat to the reign of Suryavarman II (c. 1113–1150), on the strength of hundreds of Khmer and Sanskrit inscriptions, bas-reliefs depicting the king himself in procession, and the temple's clear stylistic position within a well-documented architectural sequence running from the 9th-century capitals at Hariharalaya and Phnom Kulen through to the Bayon of Jayavarman VII around 1200. The Chinese envoy Zhou Daguan lived at Angkor in 1296–97 and left a detailed eyewitness account of a thriving city. Radiocarbon dating, ceramics and excavation stratigraphy all agree with the inscriptional chronology.
The LiDAR campaigns of 2012 and 2015, led by Damian Evans with the Khmer Archaeology LiDAR Consortium and the APSARA Authority, were among the most spectacular archaeological applications of the technology ever flown. They revealed a dense, formally gridded urban fabric surrounding the great temples, the 8th–9th-century mountain capital of Mahendraparvata on Phnom Kulen, field systems, house mounds and mysterious geometric 'coil' earthworks. Demographic modelling published in 2021 estimated Greater Angkor's population at 700,000–900,000 people at its 13th-century peak. Crucially, everything the lasers found fits the known Khmer sequence — a medieval city, not an older lost one.
The Greater Angkor Project under Roland Fletcher of the University of Sydney has traced the city's decline to the strain placed on its vast water-management network by decades-long megadroughts in the 14th–15th centuries, identified in tree-ring records by Brendan Buckley's team, punctuated by destructive monsoon flood years — an infrastructure failure story rather than a single sacking, after which the court shifted towards Phnom Penh while Angkor Wat itself was never fully abandoned.
- Hundreds of dated Khmer and Sanskrit inscriptions, including reliefs naming Suryavarman II at Angkor Wat
- Zhou Daguan's 1296–97 eyewitness account of the living city
- A continuous, excavated architectural sequence from 9th-century capitals to the Bayon
- 2012 and 2015 LiDAR surveys revealing a formally planned medieval urban grid consistent with the known chronology
- Tree-ring evidence of 14th–15th-century megadroughts matching the water network's decline